Visualize This! visualization competition
Announcing winners
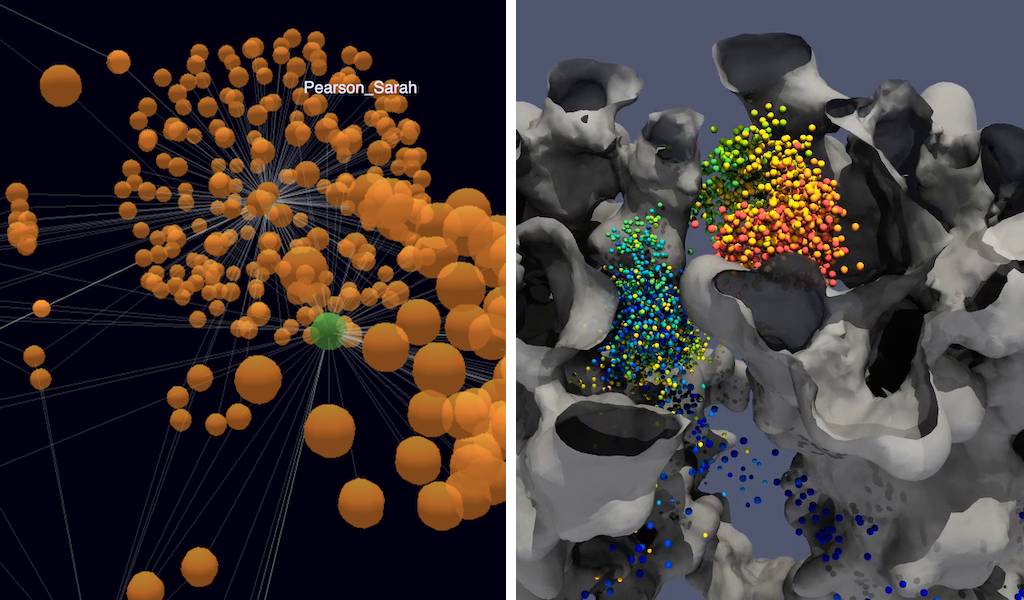
2018 Visualize This! Challenge was hosted by WestGrid, a regional partner of Compute Canada. 31 people and groups expressed interest in participating in the competition this year, and we had some interesting submissions. After thoughtful deliberation the jury has picked three winners. First place The first place was taken by Philippe Nazair, a... Read more 18 Dec 2018 - 2 minute read
New prize
Entered our 2018 Visualize This! Challenge yet? We have a new prize up for grabs, a 43” Dell 4K monitor, generously donated by Dell EMC. Smaller prizes include fast external SSDs and subsidized travel to a WestGrid 2019 Research Computing Summer School. For more information, please check the Scientific Dataset and the Humanities Dataset deta... Read more 22 Oct 2018 - less than 1 minute read
Datasets are now available
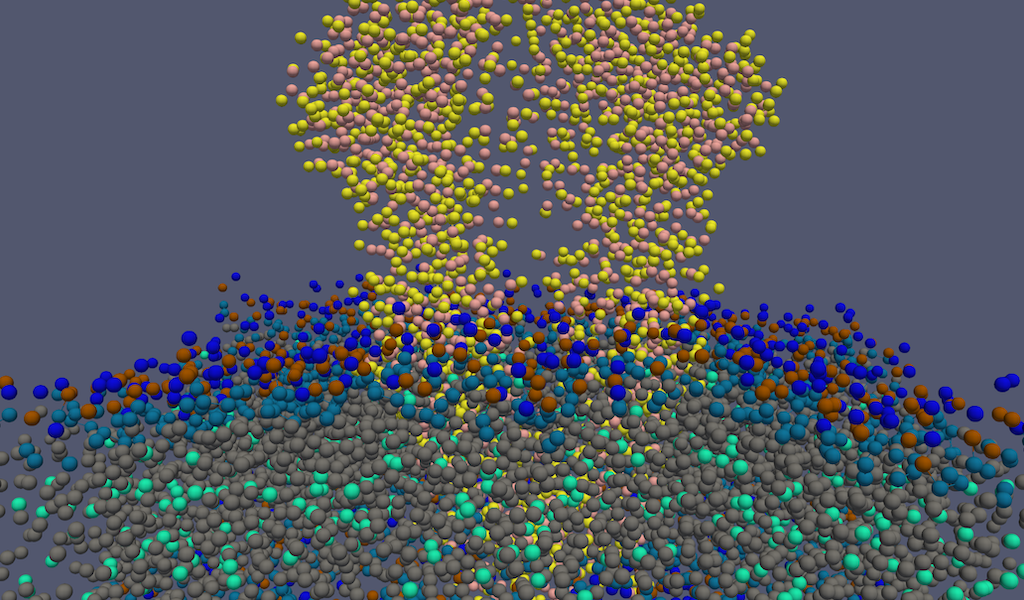
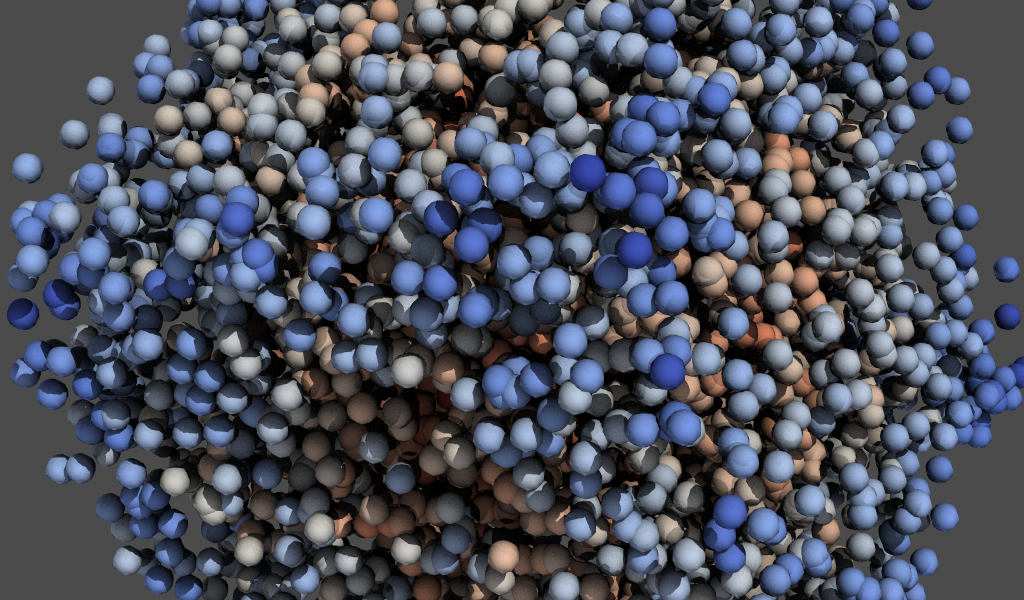
Both datasets are now available for downloading. Please select one of the two competition tracks below. Molecular Dynamics Dataset (scientific track) can be downloaded as a 312MB ZIP file. Alternatively, you can download this dataset in the PDB file format which can be loaded easily into VMD and (unlike the XTC files) is human-readable. Down... Read more 30 Sep 2018 - less than 1 minute read
Welcome to the challenge!
What is the Visualize This! Challenge? Now in its third year, Visualize This! is a Canada-wide competition that aims to celebrate the innovative ways visualization can help researchers explore datasets and answer important scientific questions. Visualize This! is your chance to challenge your creativity, experiment with new visualization tools,... Read more 12 Sep 2018 - 2 minute read